Cost effectiveness and the data we can and can't see
- Jennifer Scheuerell

- Jun 23, 2021
- 3 min read
Updated: Feb 28, 2023
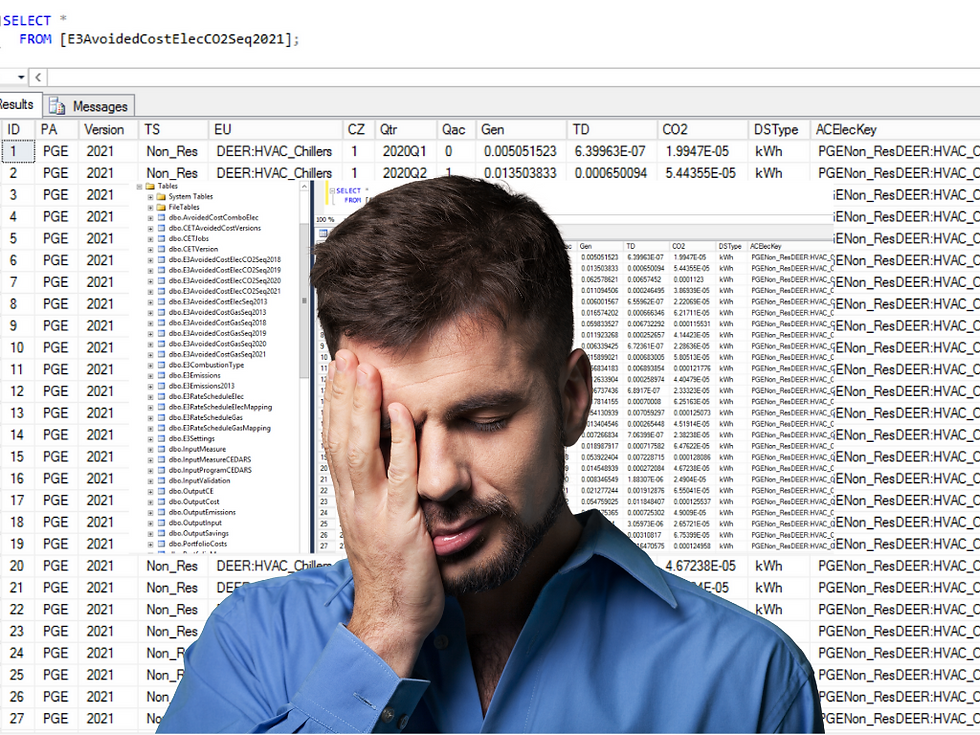
The California Public Utility Commission calculates the dollar value of energy efficiency actions using a cost effectiveness tool that uses both data inputs from users and avoided cost data embedded in the tool to determine cost effectiveness. But unless you dig into the cost effectiveness tool database to learn for yourself how the calculation works, it is difficult to understand the influence of the avoided cost data embedded in the tool on the cost effectiveness metrics that are output.
And it turns out there a number of barriers that keep people from cracking open the cost effectiveness tool to investigate its inner workings, including having the proprietary database software required and having the both the time and ability to read and trace data through copious amounts of SQL, so let's break it down.
Data users see and control
Users directly input data that describe:
The energy savings
The cost to deliver the action to the consumer
The energy consumption profile (i.e. the timing of when the saving occur within a year)
The life of the energy consumption reduction in years
The energy consumption profile and the life of the savings in years input by the user determine the avoided cost data that are pulled in by the tool and used in the calculation. This means that the same energy savings and cost inputs will produce different cost effectiveness scores depending on the energy consumption profile that the user inputs.
Data embedded in the calculator
Embedded in the cost effectiveness tool database there are large tables (~2.5M records each) of avoided cost data broken out by energy consumption profiles that determine whether the user input savings and costs tally up to be cost effective or not. An implication of having preloaded avoided cost data embedded in the cost effectiveness tool is that user input energy consumption profiles must match up with the embedded avoided cost data for user inputs to calculate cost effectiveness.
While the cost effectiveness tool has detailed quality control rules to ensure that data inputs match up with the embedded avoided costs, users are on their own to uncover and understand the influence of those fields - and the underlying embedded data - on the cost effectiveness calculation.
The avoided cost data map to data inputs using four fields that together describe the energy consumption profile. Each of those four fields have predefined values that are the only values allowed to be input, but it isn't as simple as any combination of the four fields will map to avoided costs - only certain combinations of the input fields have avoided cost data.
Avoided cost combinations
So users have to comply with individual field value list rules, and then also ensure that the combination of four avoided cost fields align with the avoided cost data. There are 90K avoided cost combinations available in the embedded data, so it isn't simple to find and select the best option for any particular line of data inputs.
That's why we recently released a smart feature in My Data Chameleon to guide users through finding valid avoided cost combinations for their data. Our smart combination finder allows users to chose the fields that have values they are sure about and then only see the options for the other fields that match up with the locked values to produce a valid avoided cost combination.
We are excited about this new feature saving our users time and frustration. Beyond that, this is our first step in opening up insights into the embedded avoided cost data to enable our users to make better decisions and drive smart efficiency actions going forward.
We invite you to sign up for a free My Data Chameleon account and check it out for yourself.


Comments